
Series and Parallel Resistances
Exercises
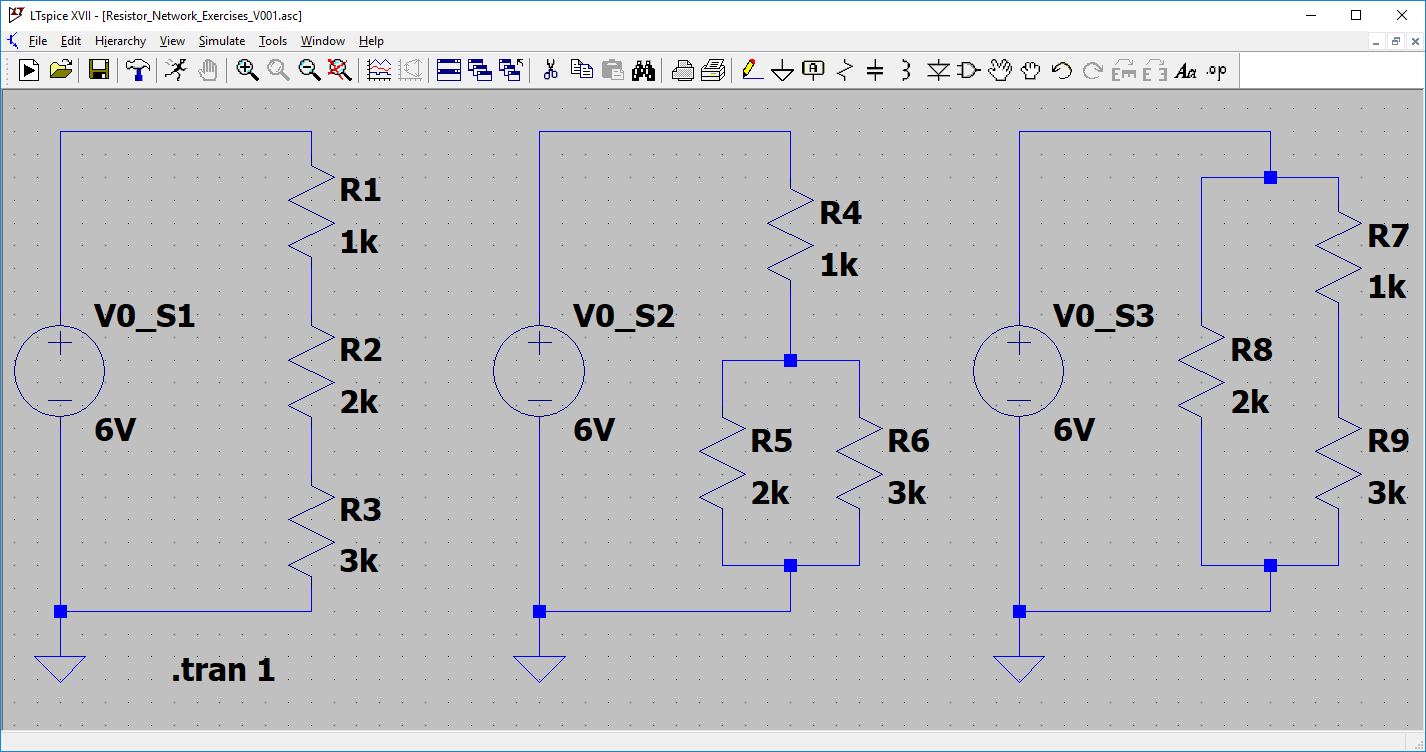 |
| Fig.: Three independent circuits with three independent voltage sources. |
Calculate!
Question 1:
What is the total resistance in the left circuit? Which total current $I_L$ results from it?
Question 2:
The first voltage source has a voltage of $V_{0,S1} = 6{\rm V}$. What is voltage drop $\Delta V_1$ across resistor $R_1$?
Question 3:
What is the voltage level (with respect to ground) at the node (junction) between $R_1$ and $R_2$?
Question 4:
What is the total resistance in the middle circuit? Which total current $I_M$ results from it?
Hint: First calculate the parallel resistance $R_p$ of $R_5$ and $R_6$.
You can think of $R_p$ being a single equivalent resistor replacing $R_5$ and $R_6$ without changing the effect.
Then calculate the series resistance of $R_p$ and $R_4$.
Question 5:
What is the voltage level at the node (junction) connecting $R_4$, $R_5$, and $R_6$?
Question 6:
What is the current $I_6$ running through $R_6$?
Question 7:
What is the total resistance in the right circuit? Which total current $I_R$ results from it?
Question 8:
What is the voltage drop $\Delta V_7$ across $R_7$?
Question 9:
What is the voltage level at the node between $R_7$ and $R_9$?
Solution by Seif, WS2022
Thank you, Seif!
Simulate!
Install the LTspice software first. The process is described in the topic
Check your calculated voltages and currents with an LTspice simulation!
Download the following LTspice circuit file by right click → Save link as …:
resistor_network_exercises_v001.asc
Open the file in LTspice and run the simulation by clicking on the running person icon. It simulates the circuits for 1 second (transient analysis .tran 1).
After the successful simulation a black empty window pops up - the simulation results output window - in which the voltage and current curves at selected points of the circuit will be displayed.
Make sure that the circuit window (not the output window) has the focus by clicking on its upper window title bar.
When you now hover with the mouse over different parts of the circuit the mouse pointer icon changes depending on whether you can measure voltage or current at the respective location in the circuit. The icon changes to a voltage probe head, when voltage measurements are possible. The icon changes to a current clamp when current measurements are possible.
Generally voltage measurements are available at nodes (e.g. connecting wires) and current measurements only “in” or trough electric components. Try it out. Move the mouse to wires and to components like resistors or voltage sources. Observe how the icon changes.
Now measure voltages and currents in the circuit by clicking at locations you would like to measure. The respective curves show up in the black output window. You have to different scales for voltage and current at the left and right vertical axes of the diagram, respectively.
Voltages and currents are constant in these examples and do not change, anyway. This is correct. You get constant output curves which allow you to read the voltage levels at selected nodes and currents running through the selected circuit part.
Check your calculation results from the previous exercises!
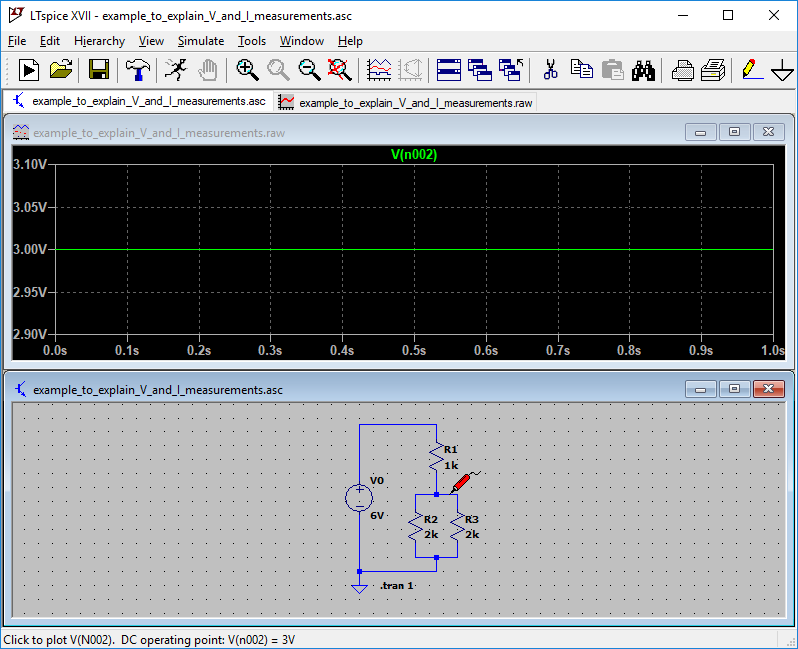 | 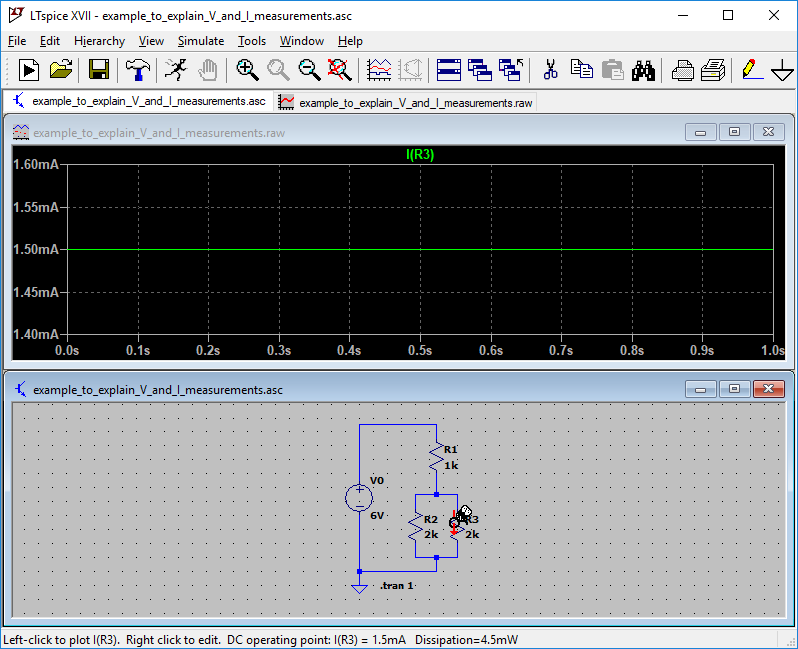 |
| Fig.: Example voltage measurement at node $n002$, mouse pointer icon changes to a voltage probe head. | Fig.: Example current measurement through $R_3$, mouse pointer icon changes to a current clamp. |